New Delhi, 23 February, 2022 (GPN): The PHD Chamber of Commerce and Industry projects FY 2022 GDP growth at 9.3-9.7% on the back of supportive Government policies, decelerating impact of Coronavirus and continued improvement in key economic and business indicators, said Mr Pradeep Multani, President, PHD Chamber of Commerce and Industry, in a press statement issued here today.
The Industry Body said that the Q3 FY 2022 GDP growth is expected to be more than 6.1%, somewhere in the range of 6.1-6.5%.
According to the PHDCCI Economic & Business Momentum (EBM) Index, the 25 lead economic and business indicators have shown a significant recovery at 102.8 for Q3 FY 2021-22 as compared to 98.2 for Q3 FY 2020-21, at the base of 2018-19 = 100.
Economic recovery so far (Y-o-Y)
| PHDCCI EBM Index
2018-19=100 |
Q3 FY 2017-18 | Q3 FY 2018-19 | Q3 FY 2019-20 | Q3 FY 2020-21 | Q3 FY 2021-22 |
| 98.2 | 100.1 | 98.6 | 98.2 | 102.8 |
Source: PHD Research Bureau, PHDCCI EBM Index
Lead economic and business indicators such as SENSEX, merchandise exports and services exports have shown a noteworthy improvement in Q3 FY 2021-22 as compared to the Q3 FY 2020-21, said Mr Pradeep Mulatni.
Sequentially, the PHDCCI EBM Index has shown an uptrend for Q3 FY 2021-22 to the level of 102.8 as compared to 101.5 for Q2 FY 2021-22, said Mr Pradeep Multani.
Economic recovery so far (Sequential)
| PHDCCI EBM Index
2018-19=100 |
Q1 FY 2020-21 | Q2 FY 2020-21 | Q3 FY 2020-21 | Q4 FY 2020-21 | Q1 FY 2021-22 | Q2 FY 2021-22 | Q3 FY 2021-22 |
| 85.2 | 96.0 | 98.2 | 99.7 | 97.9 | 101.5 | 102.8 |
Source: PHD Research Bureau, PHDCCI EBM Index.
The quarterly movement of PHDCCI EBM Index and quarterly GDP growth rates are highly correlated at 0.8 as depicted in Chart-2, said Mr Pradeep Multani.
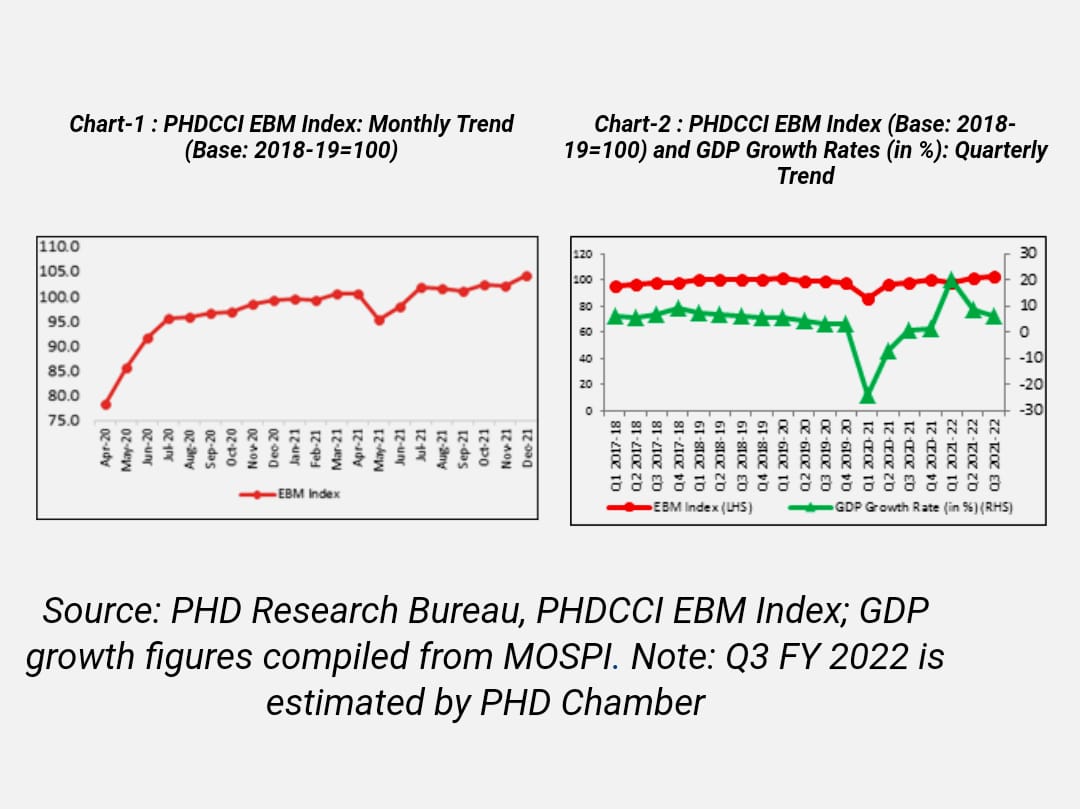
PHDCCI EBM (Economic and BusinessMomentum) Index has shown steady recovery from the lows of 78.3 for April 2020 to 100.3 for April 2021, 95.3 for May 2021 as compared with 85.7 for May 2020, 98 for June 2021 as compared to 91.6 in June 2020, 102.1 for July 2021 as compared to 95.5 in July 2020, 101.7 for August 2021 as compared to 95.9 in August 2020, 101.1 for September 2021 as compared to 96.5 in September 2020, 102.3 for October 2021 as compared to 96.8 in October 2020, 102.0 for November 2021 as compared to 98.4 for November 2020 and 104.1 for December 2021 as compared to 99.3 for December 2020 with a base of 2018-19=100.
Going ahead, the pace of economic activity is expected to remain strong on the back of various structural reforms undertaken by the Government during the last 2 years, said Mr. Pradeep Multani.
The recent budget announced by the Government for the FY 2022-23 looks into the future while keeping a close eye on the ground. The Budget is a step forward towards the vision of creating an Atmanirbhar Bharat and reflects a consistency in government’s approach in making India a Modern, Developed and Inclusive nation, said Mr. Pradeep Multani.
PHDCCI EBM Index is a composite index of 25 lead economic and business indicators with base year at 2018-19=100, which considers the demand and supply indicators to present a broad perspective of the economy. The 25 indicators include the IIP Consumer durable goods, IIP Consumer non-durable goods, IIP Capital Goods, IIP Intermediate Goods, Coal, Crude Oil, Natural Gas, Petroleum Refinery Products, Fertilisers, Steel, Cement, Electricity, Consumption of Petroleum products, Export Merchandise, Export Services, India Freight Traffic, Credit to Agriculture, Credit to Industry, Credit to service sector, Personal Loans, GST Collections, SENSEX, FDI Equity Inflows, External commercial borrowings and Unemployment.
Full PHDCCI EBM Index report attached
PHDCCI EBM Index
Base: 2018-19=100
| Sr No | Economic Indicators | Q3
FY 2020-21 |
Q3
FY 2021-22 |
Q3 FY 2021-22 – Q3 FY 2020-21 | |
| 1 | IIP Consumer durable goods | 96.9 | 96.9 | -3.9 | |
| 2 | IIP Consumer non-durable goods | 122.9 | 122.9 | 0.3 | |
| 3 | IIP Capital Goods | 90.7 | 90.7 | -2.5 | |
| 4 | IIP Intermediate Goods | 119.7 | 119.7 | 2.5 | |
| 5 | Coal | 116.8 | 116.8 | 10.0 | |
| 6 | Crude Oil | 83.0 | 83.0 | -1.8 | |
| 7 | Natural Gas | 108.2 | 108.2 | 20.2 | |
| 8 | Petroleum Refinery Products | 108.2 | 108.2 | 7.9 | |
| 9 | Fertilizers | 109.5 | 109.5 | 2.2 | |
| 10 | Steel | 121.8 | 121.8 | 1.7 | |
| 11 | Cement | 130.6 | 130.6 | 9.6 | |
| 12 | Electricity | 113.9 | 113.9 | 2.7 | |
| 13 | Consumption of Petroleum products | 109.2 | 109.2 | -2.4 | |
| 14 | Export Merchandise Growth | 153.8 | 153.8 | 40.8 | |
| 15 | Export Services | 163.6 | 163.6 | 36.0 | |
| 16 | India Freight Traffic | 112.6 | 112.6 | 6.9 | |
| 17 | Credit to Agriculture | 111.7 | 111.7 | 3.3 | |
| 18 | Credit to Industry | 105.2 | 105.2 | 6.4 | |
| 19 | Credit to service sector | 105.8 | 105.8 | -3.3 | |
| 20 | Personal Loans | 112.5 | 112.5 | 2.9 | |
| 21 | GST Collection | 130.5 | 130.5 | 22.0 | |
| 22 | SENSEX (Daily average) | 214.6 | 214.6 | 58.2 | |
| 23 | FDI Equity Inflows | 128.2 | 128.2 | -63.9 | |
| 24 | External commercial borrowings | 154.4 | 154.4 | 26.2 | |
| 25 | Unemployment | 96.6 | 96.6 | 0.0 | |
| Composite Weighted Index | 98.2 | 102.8 | 4.6 | ||
Source: PHD Research Bureau, PHDCCI EBM Index Note: For calculation purpose, the FDI figure for October, November, December 2021 are moving average of last 3 months; figures are rounded off.
Be the first to comment on "The PHDCCI Economic and Business Momentum (EBM) Index; PHD Chamber projects more than 9.3% GDP growth in 2022-23"