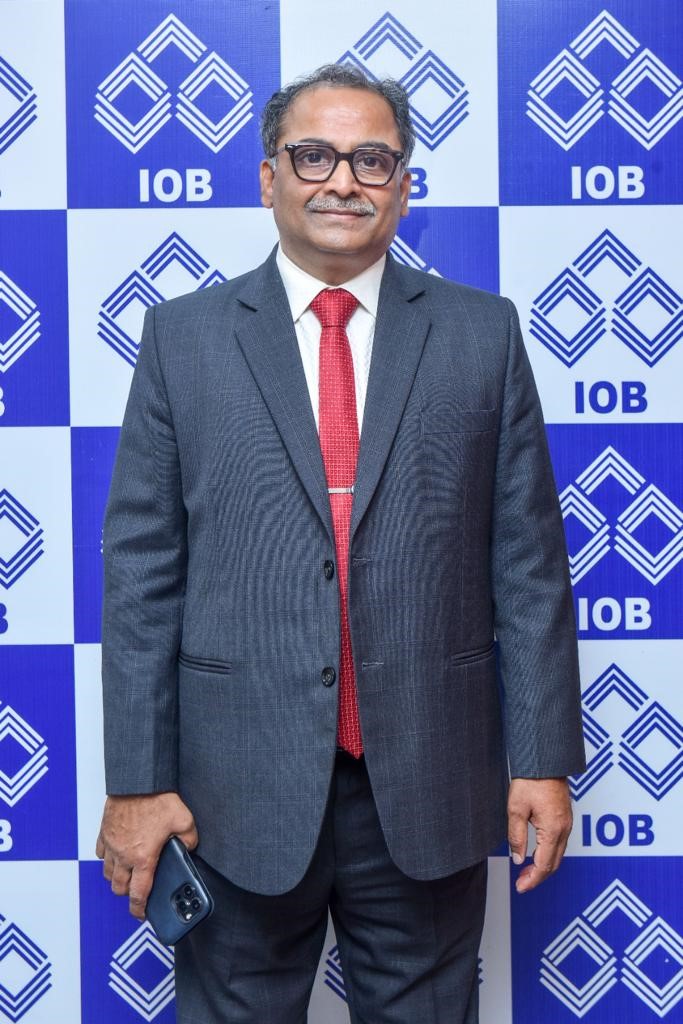
Shri Ajay Kumar Srivastava, CEO, Indian Overseas Bank (IOB) – Photo By GPN
MUMBAI, 28 OCTOBER, 2023 (GPN): Indian Overseas Bank (IOB) announced today its financial report for the second quarter of the fiscal year 2023-24.
Against the backdrop of fluctuating market conditions, IOB had booked a total income of Rs 6,935.21 crore (Q2FY23 Rs 5,852.45 crore) and posted a net profit of Rs 624.58 crore ($84.6 million), a surge of 25% compared to the Rs 501.34 crore recorded in the same period last year. The bank’s net interest income, the lifeblood of any lending institution, also rose by 22% at Rs 5,821 crore for the quarter ended September 30, 2023 as against Rs 4,718 crore for the quarter ended September 30, 2022.
The non-interest income stood at Rs 1,114 crore for the year ended September 30, 2023 as against Rs 1,135 crore for the year that ended September 30, 2022.
Beyond these headline numbers, the IOB’s total business swelled to Rs 4,82,006 crore as of September 30, 2023, marking an 11% increase from Rs 4,34,441 crore last year.
As on September 30, 2023 IOB’s gross non performing assets (GNPA) and net NPA stood at Rs 9,893.30 crore (Rs 14,726.35 crore) and Rs 1,364.34 crore (Rs 4,148.60 crore) respectively.
IOB’s gross NPAs dropped sharply to 4.74% from 8.53% in the same quarter of the previous fiscal year.IOB had provided Rs 1,120.50 crore towards NPA up from Rs.627.15 crore provided during the previous year corresponding period.This reduction in NPAs is a testament to the bank’s risk management strategies and its efforts to strengthen its balance sheet.
On Friday, October 27 the bank’s shares rose by seven per cent, reflecting renewed investor confidence. The bank’s capital adequacy ratio (CAR), a measure of a bank’s capital in relation to its risk, stood at a healthy 17%, far exceeding the regulatory requirement of 9%. This high CAR ratio indicates that the bank has a robust capital buffer to protect its depositors.
Key Highlights
| Particulars | 30.09.2023
(3 Months) |
30.09.2022
(3 Months) |
30.09.2023
(6 Months) |
30.09.2022
(6 Months) |
||
| Operating Profit |
1,677 |
1,494 |
|
3,022 |
2,520 |
|
| Net Profit / Loss |
625 |
501 |
|
1,125 |
893 |
|
| Deposits |
2,73,093 |
2,61,728 |
|
2,73,093 |
2,61,728 |
|
| Gross Advances |
2,08,913 |
1,72,713 |
|
2,08,913 |
1,72,713 |
|
| Gross Investments |
97,891 |
97,035 |
|
97,891 |
97,035 |
|
| Business Mix |
4,82,006 |
4,34,441 |
|
4,82,006 |
4,34,441 |
|
| CASA |
1,19,206 |
1,11,924 |
|
1,19,206 |
1,11,924 |
|
| CASA Ratio |
43.65% |
42.76% |
|
43.65% |
42.76% |
|
| Gross NPA |
9,893 |
14,726 |
|
9,893 |
14,726 |
|
| Net NPA |
1,364 |
4,148 |
|
1,364 |
4,148 |
|
| Net Interest Margin |
3.12% |
2.79% |
|
3.18% |
2.66% |
|
| Gross NPA Ratio |
4.74% |
8.53% |
|
4.74% |
8.53% |
|
| Net NPA Ratio |
0.68% |
2.56% |
|
0.68% |
2.56% |
|
| Cost to Income Ratio |
51.53% |
51.62% |
|
54.11% |
53.63% |
|
| PCR |
96.76% |
90.94% |
96.76% |
90.94% |
||
| CRAR |
17.00% |
15.14% |
|
17.00% |
15.14% |
|
| RoE |
16.16% |
15.42% |
|
14.79% |
13.94% |
|
| CD Ratio |
76.50% |
65.99% |
|
76.50% |
65.99% |
|
| RoA |
0.75% |
0.65% |
|
0.69% |
0.58% |
|
|
Y-o-Y |
Variance |
|||
|
30.09.2023 |
30.09.2022 | Rs. in crore | % Growth | |
| Operating Profit |
1677 |
1494 |
183 |
12.25% |
| Net Profit |
625 |
501 |
124 |
24.75% |
- Total Business increased to Rs.4,82,006 Croresas on 30th September 2023 from Rs.4,34,441 Croresas on 30th September 2022.
- Total Deposits stood at Rs.2,73,093 Crores as on 30th September 2023 as against Rs.2,61,728 Crores as on 30th September 2022.
- CASA of the Bank increased to Rs.1,19,206 Crores at 43.65% as on 30th September 2023 against Rs.1,11,924 Crores at 42.76% as on 30th September 2022.
- Gross Advances stoodat Rs.2,08,913 Croresas on 30th September 2023 as against Rs.1,72,713 Crores as on 30th September 2022.
- Operating Profit stood at Rs.1,677 Crores as on 30th September 2023 as against Rs.1,494 Crores as on 30th September 2022.
- Net profit for the quarter ended 30th September 2023 stood at Rs.625 Crores as against Rs. 501 Crores for the quarter ended 30th September 2022.
- Total Income for the quarter ended 30th September 2023 is Rs.6,935 Croresas against Rs.5,852Crores for the quarter ended 30th September 2022.
- Interest Income stood at Rs.5,821 Crores for the quarterended 30th September 2023 as against Rs.4,718 Crores for the quarter ended 30th September 2022.
- Non-Interest Income stood at Rs.1,114 Crores for the year ended 30th September 2023 as againstRs.1,135 Crores for the year ended 30thSeptember 2022.
- NPA MANAGEMENT: Gross NPA as of 30th September 2023 stood at Rs.9893 Crores with ratio of 4.74% as against Rs.14,726 Crores with ratio of 8.53% as on 30th September 2022. GNPA has reduced both in quantum and as a percentage of Gross Advances(YoY).
- Reduction in Gross NPA for the quarter ended 30th September 2023 stood at Rs.4,833 Crores as against year ended 30th September 2022.
- Total Cash Recovery for September 2023 was Rs.435Crores as againstRs.494 Crores in September 2022.
- Net NPA as on 30th September 2023 stood at Rs.1,364 Crores with ratio of 0.68% as against Rs.4,148 Crores with ratio of 2.56% as on 30th September 2022 thus reducing Net NPA by Rs.2,784 Crores in absolute terms.
- Provision Coverage Ratio stood at 96.76% as on 30th September 2023 as against 90.94% as on 30th September 2022. Bank has made required provisioning in advances in specific Accounts to improve Net NPA.
-
KEY FINANCIALRATIOS (YoY):
- Average Cost of Deposit is 4.69% as on 30.09.2023as against 4.11% as on 30.09.2022.
- Average Yield on Advances stood at 8.78% as on 30.09.2023 as against 7.83% as on 30.09.2022.
- Net Interest Margin stood at 3.12% for as on 30.09.2023 as against 2.79% as on 30.09.2022.
- Credit Deposit Ratio is 76.50% as on 30.09.2023 as against 65.99% as on 30.09.2022.
-
CAPITAL ADEQUACYRATIO (CRAR):
(As on 30.09.2023)
| Particulars |
Basel III |
Regulatory Requirement |
| CET 1 |
13.81% |
5.50% |
| Tier I |
13.81% |
7.00% |
| Tier II |
3.19% |
2.00% |
| Total CRAR |
17.00% |
9.00%* |
*Excluding CCB


Be the first to comment on "Indian Overseas Bank (IOB) Announces Q2FY24 Results posts Rs 624.34 crore PAT"