 PERFORMANCE FOR THE YEAR ENDED JUN 30, 2020
Other Key Highlights:
- 50% growth in Individual Protection APE
- 24% growth in renewal premium
- 24.3% New Business Margin on the back of balanced product mix
- PAT of Rs 451 Crs, with growth of 6%
- Healthy Solvency at 190%
MUMBAI, JULY 22, 2020 (GPN): The Board of Directors of HDFC Life approved and adopted today the audited standalone and reviewed consolidated financial results for the quarter ended June 30, 2020. Below is the summary of our standalone results:

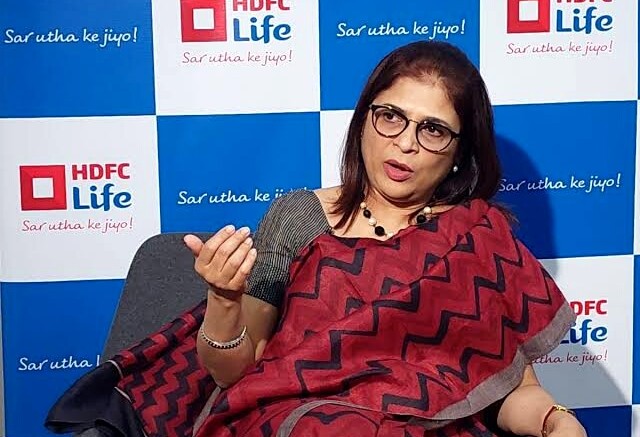
Ms. Vibha Padalkar, MD & CEO, HDFC Life -File Photo GPN
Commenting on the current situation, Ms. Vibha Padalkar, MD & CEO said “As the economy is coming to terms with the effects of the pandemic, we are increasingly witnessing encouraging on-ground trends. Business has started to pick up on a month-on-month basis and we are seeing higher traction, especially in the individual protection business. As the situation begins to normalise, we expect life insurance to emerge as an important avenue for both protection as well as long term savings, and consequently help attract a higher quantum of inflows from Indian households.”
 Commenting on the Q1 FY21 performance, Ms. Vibha Padalkar, MD & CEO said “We continue to exhibit resilient performance even in the current scenario. Our market share in terms of Individual WRP has increased by 100 basis points from 17.5% to 18.5%. Our calibrated approach of maintaining a balanced product mix has again enabled us to manoeuvre through a turbulent environment and adapt faster than the overall market. We remain well positioned to provide a sustainable value proposition to our customers, partners and shareholders in these challenging times.”
Key Financial Summary
| Rs Cr | Q1 FY21 | Q1 FY20 | YoY | FY20 | FY19 | |
| Key Financial and Actuarial Metrics | ||||||
| Individual APE | 1,072 | 1,378 | -22% | 6,145 | 5,204 | |
| Total APE | 1,198 | 1,710 | -30% | 7,407 | 6,260 | |
| New Business Premium (Indl + Group) | 2,623 | 3,926 | -33% | 17,239 | 14,971 | |
| Renewal Premium (Indl + Group) | 3,239 | 2,610 | 24% | 15,468 | 14,215 | |
| Total Premium | 5,863 | 6,536 | -10% | 32,707 | 29,186 | |
| Assets Under Management | 139,975 | 1,29,581 | 8% | 1,27,226 | 1,25,552 | |
| Networth | (1) | 7,448 | 6,084 | 22% | 6,992 | 5,659 |
| Profit After Tax | 451 | 425 | 6% | 1,295 | 1,277 | ||
| Indian Embedded Value | 22,580 | 19,230 | 17% | 20,650 | 18,301 | ||
| Value of new business | 291 | 509 | -43% | 1,919 | 1,537 | ||
| Protection based on Individual APE | 113 | 75 | 50% | 466 | 351 | ||
| Protection based on APE | 157 | 304 | -48% | 1,270 | 1,045 | ||
| Q1 FY21 | Q1 FY20 | FY20 | FY19 | ||||
| Key Financial Ratios | |||||||
| New Business Margins | 24.3% | 29.8% | 25.9% | 24.6% | |||
| Operating Return on EV | 15.8% | 19.9% | 18.1% | 20.1% | |||
| Operating Expenses / Total Premium | 11.5% | 13.4% | 13.1% | 13.1% | |||
| Solvency Ratio | 190% | 193% | 184% | 188% | |||
| 13M / 61M Persistency | (2) | 87%/53% | 85%/53% | 88%/54% | 87%/52% | ||
| Product mix by Indl APE (UL / Non par savings / Non par protection / Par) | 27/33/11/30 | 26/63/5/6 | 28/45/8/19 | 55/20/7/18 | |||
| Distribution mix by Indl APE (Corp Agents/ Agency/ Broker/ Direct) | 59/12/5/24 | 56/15/9/20 | 55/14/9/22 | 64/13/4/19 | |||
Notes:
- Networth comprises Share capital, Share premium and Accumulated profits
- Persistency ratios are calculated basis original premium, for Individual business
Other key highlights for the year ending Jun 30, 2020:
- Private Market Share: Ranked #1 in terms of Individual WRP with market share expanding by 100 bps from 17.5% to 18.5%. Our share within the group and overall new business segment stood at 20.7% each
- Product Portfolio: We continue to maintain a balanced product mix with share of participating savings, non participating savings, ULIPs, protection and annuity accounted for 30%, 28%, 27%, 11% and 5% of Individual APE respectively. Our focus on the protection segment resulted in 50% growth in the individual protection segment
- Distribution Mix: Our diversified distribution mix is evidenced by the wide access to our customers with 270 plus partners, including more than 40 new-ecosystem partners as on June 30, 2020. This is further supplemented by our 421 branches spread across the country
- Assets Under Management: As on June 30, 2020, our AUM was Rs. 1.4 lakh Cr. (Debt:Equity mix – 68:32); about 97% of debt investments were in G-Secs and AAA bonds as on June 30, 2020
Definitions and abbreviations
- Annualized Premium Equivalent (APE) – The sum of annualized first year regular premiums and 10% weighted single premiums and single premium top-ups
- Assets under Management (AUM) – The total value of Shareholders’ & Policyholders’ investments managed by the insurance company
- Embedded Value Operating Profit (EVOP) – Embedded Value Operating Profit (“EVOP”) is a measure of the increase in the EV during any given period, excluding the impact on EV due to external factors like changes in economic variables and shareholder-related actions like capital injection or dividend pay-outs
- First year premium – Premiums due in the first policy year of regular premiums received during the financial year. For example, for a monthly mode policy sold in March 2021, the first monthly instalment received would be reflected as First year premiums for 2020-21 and the remaining 11 instalments due in the first policy year would be reflected as first year premiums in 2021-22, when received
- New business received premium – The sum of first year premium and single premium, reflecting the total premiums received from the new business written
- Operating expense – It includes all expenses that are incurred for the purposes of sourcing new business and expenses incurred for policy servicing (which are known as maintenance costs) including shareholders’ expenses. It does not include commission
- Operating expense ratio – Ratio of operating expense (including shareholders’ expenses) to total premium
- Operating return on EV – Operating Return on EV is the ratio of EVOP (Embedded Value Operating Profit) for any given period to the EV at the beginning of that period
- Persistency – The proportion of business renewed from the business underwritten. The ratio is measured in terms of number of policies and premiums underwritten
- Premium less benefits payouts – The difference between total premium received and benefits paid (gross of reinsurance)
- Renewal premium – Regular recurring premiums received after the first policy year
- Solvency ratio – Ratio of available solvency margin to required solvency margin
- Total premium – Total received premiums during the year including first year, single and renewal premiums for individual and group business
- Weighted received premium (WRP) – The sum of first year premium received during the year and 10% of single premiums including top-up premiums ENDS
About HDFC Life
HDFC Life Insurance Company Limited (formerly HDFC Standard Life Insurance Company Limited) (‘HDFC Life’ / ‘Company’) is a joint venture between HDFC Ltd., India’s leading housing finance institution and Standard Life Aberdeen, a global investment company.
Established in 2000, HDFC Life is a leading long-term life insurance solutions provider in India, offering a range of individual and group insurance solutions that meet various customer needs such as Protection, Pension, Savings, Investment, Annuity and Health. As on June 30, 2020, the Company had 36 individual and 12 group products in its portfolio, along with 6 optional rider benefits, catering to a diverse range of customer needs.
HDFC Life continues to benefit from its increased presence across the country having a wide reach with 421 branches and additional distribution touch-points through several new tie-ups and partnerships. The count of our partnerships is in excess of 270, comprising traditional partners such as NBFCs, MFIs and SFBs, and includes more than 40 new-ecosystem partners. The Company has a strong base of financial consultants.
For more information, please visit our website, www.hdfclife.com. You may also connect with us on Facebook, Twitter, YouTube and LinkedIn.
Be the first to comment on "HDFC Life Market share grows by 100 bps to 18.5%; Strong NBM of 24.3%"